How to Link Modules to a Market Analyzer?
Users can link modules to a Market Analyzer (Quote Board) by assigning matching colors using the dropdown next to the instrument name in the tab at the top of each module in the KGI Crusoe platform.
Published
Topic
Getting Started
Users can link modules to a Market Analyzer (Quote Board) by assigning matching colors using the dropdown next to the instrument name in the tab at the top of each module in the KGI Crusoe platform.
Instrument Linking enables you to change the selected instrument across all linked modules with a single click in the Market Analyzer module.
Table of Contents
Linking Modules to the Market Analyzer
Important Notes
Linking Modules to the Market Analyzer
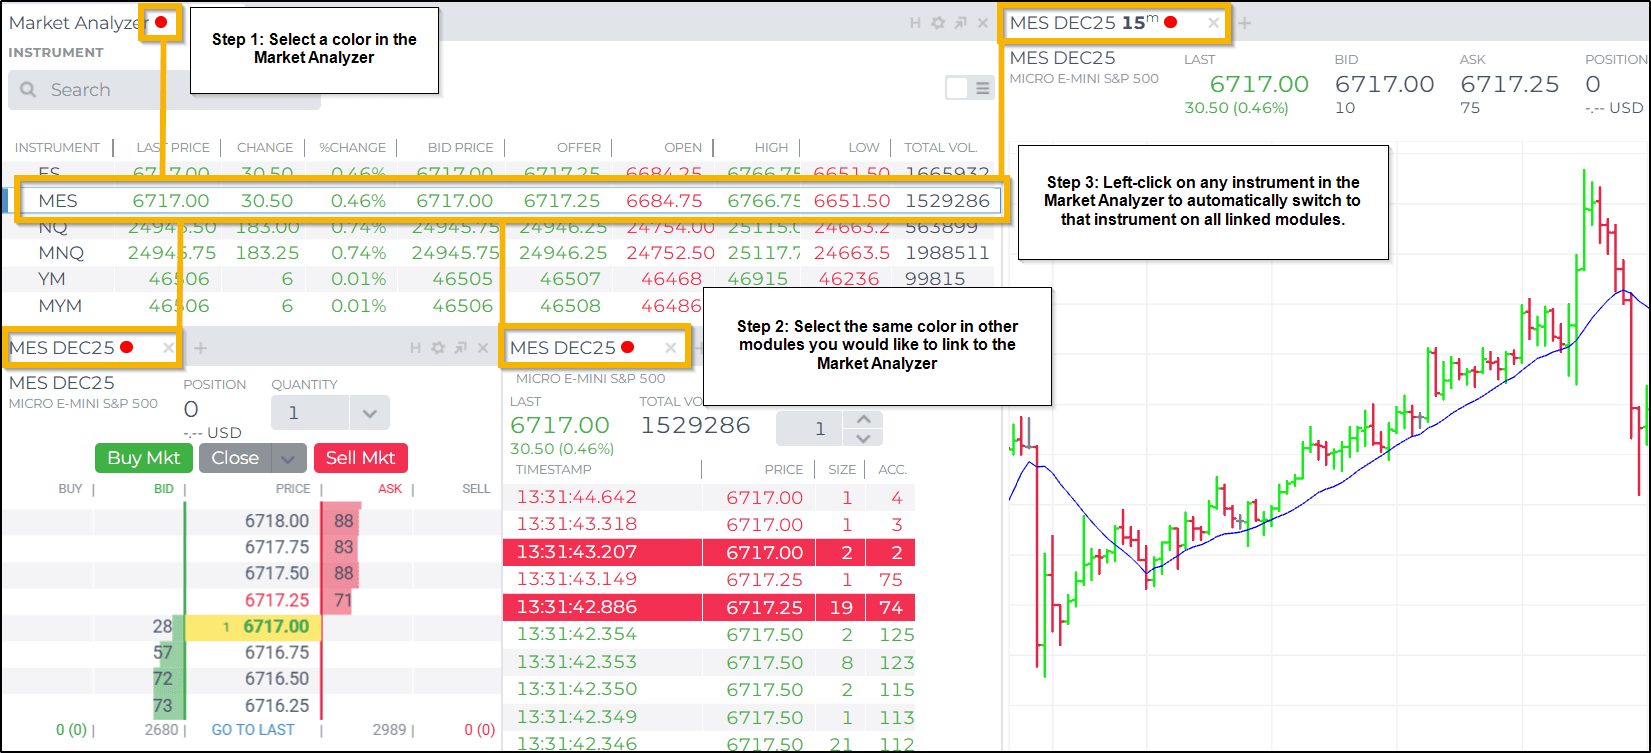
To begin linking modules in your Workspace, click the gray dot next to "Market Analyzer" in the tab at the top of the module. From the dropdown, select a color of your preference.

Any other modules in your workspace with the same color selected will be linked to the Market Analyzer, allowing them to automatically switch to the instrument you left-click on within the Market Analyzer.
Instrument Linking is supported on the following modules:
SuperDOM
Chart
T&S (Time & Sales / Ticks)
Trade Performance
This guide uses redlinks as an example, but up to six different colors (red, green, blue, yellow, brown, pink) can be used for different groups in your Workspace. Gray indicates linking is disabled for that module.
Important Notes
All modules are linked through the Market Analyzer (Quote Board), and the instruments you select there trigger changes across your other linked modules. Simply linking a Chart and a DOM without also linking the Quote Board will not establish a functional link between them.
Color linking also applies to the “Show Indicators" setting in the SuperDOM. If this setting is enabled, both the SuperDOM and the Chart must be set to the same color for indicator values to appear in the indicators column on the SuperDOM.